Debug SharePoint Framework Solution in Visual Code
Hi Friends, the very common thing that we miss while coding SharePoint Framework solution is the debugging functionality like we use to did in the C# coding using Visual Studio. But now you can debug you code in the same way you use to do earlier using visual studio code.
Yes, and it is pretty easy and you can have all the functionalities that you use to have.To debug you code just follow the below steps.
Adding Extension for debugging.
The first thing you need to do if the Add the extension in your visual code “Debugger for Chrome”. Using this extension then you can debug your code using the Chrome browser. For now we have only the chrome extension available but we may see more browsers coming up with the options.
To add the extension click on the Extensions in the menu pane on the left or press Ctrl + Shift + X. Then search for the extension with the name “Debugger for Chrome” and then install it. After the extension is installed there are some configuration that needs to be made.
Configuration for debugging
Since we had two types of workbench i.e.. You can either execute your webpart in the local workbench or you can execute your webpart in the hosted workbench. So we have different configuration for both. But don’t worry this will be one time process only then you’ll be able to do any debugging.
For configuration click on the Debug in the menu pane on the left or press Ctrl + Shift + D.Now notice in the top you’ll find that there is no configuration present. So just select the ‘Add Configuration’ Option and this will generate the configuration for you. Now delete the configuration that was generated in the launch.json file and replace it with the below configuration.
{
"version": "0.2.0",
"configurations": [
{
"name": "Local workbench",
"type": "chrome",
"request": "launch",
"url": "https://localhost:4321/temp/workbench.html",
"webRoot": "${workspaceRoot}",
"sourceMaps": true,
"sourceMapPathOverrides": {
"webpack:///../../../src/*": "${webRoot}/src/*",
"webpack:///../../../../src/*": "${webRoot}/src/*",
"webpack:///../../../../../src/*": "${webRoot}/src/*"
},
"runtimeArgs": [
"--remote-debugging-port=9222"
]
},
{
"name": "Hosted workbench",
"type": "chrome",
"request": "launch",
"url": "https://contoso.sharepoint.com/_layouts/workbench.aspx",
"webRoot": "${workspaceRoot}",
"sourceMaps": true,
"sourceMapPathOverrides": {
"webpack:///../../../src/*": "${webRoot}/src/*",
"webpack:///../../../../src/*": "${webRoot}/src/*",
"webpack:///../../../../../src/*": "${webRoot}/src/*"
},
"runtimeArgs": [
"--remote-debugging-port=9222"
]
}
]
}
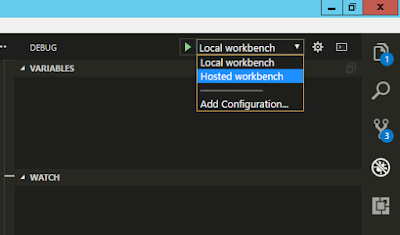
Now save the file and you will notice that now you can see two options in the same dropdown. One is local workbench and another is Hosted workbench.
Debugging SharePoint Framework using Local Workbench
If you want to debug using the local workbench then follow the below steps
- Add the breakpoint where you want to debug the code (either in the .ts file or in the .tsx file)
- Execute the command gulp serve --nobrowser. This command will compile the code and start the server for the code to run, but will not open browser as we don’t require here.
- Press Ctrl + Shift + D and select the Local workbench option in the dropdown
- Now hit F5, a new browser window will get open and now you can add the webpart. Just wedit the webpart and you will notice your debugger breakpoint is of red color indicating the breakpoint is now active.
- Debug your code and enjoy :)
Debugging SharePoint Framework using Hosted Workbench
If you need to debug the hosted workbench then follow the below steps:
- Execute the command gulp serve --nobrowser. This command will compile the code and start the server for the code to run, but will not open browser as we don’t require here.
- Press Ctrl + Shift + D and select the Hosted workbench option in the dropdown
- Now hit F5, a new browser window will get open and now you can add the webpart. Just edit the webpart and you will notice your debugger breakpoint is of red color indicating the breakpoint is now active.
- Debug your code and enjoy :)
Hope this will help in debugging your issues in the code in a much easier and faster way.
Happy Coding.
-Sumit Kanchan


Comments
Post a Comment